How Much Is Your State Paying For A Gallon Of Gas? This Cool Map Will Show You
Image may be NSFW.
Clik here to view.
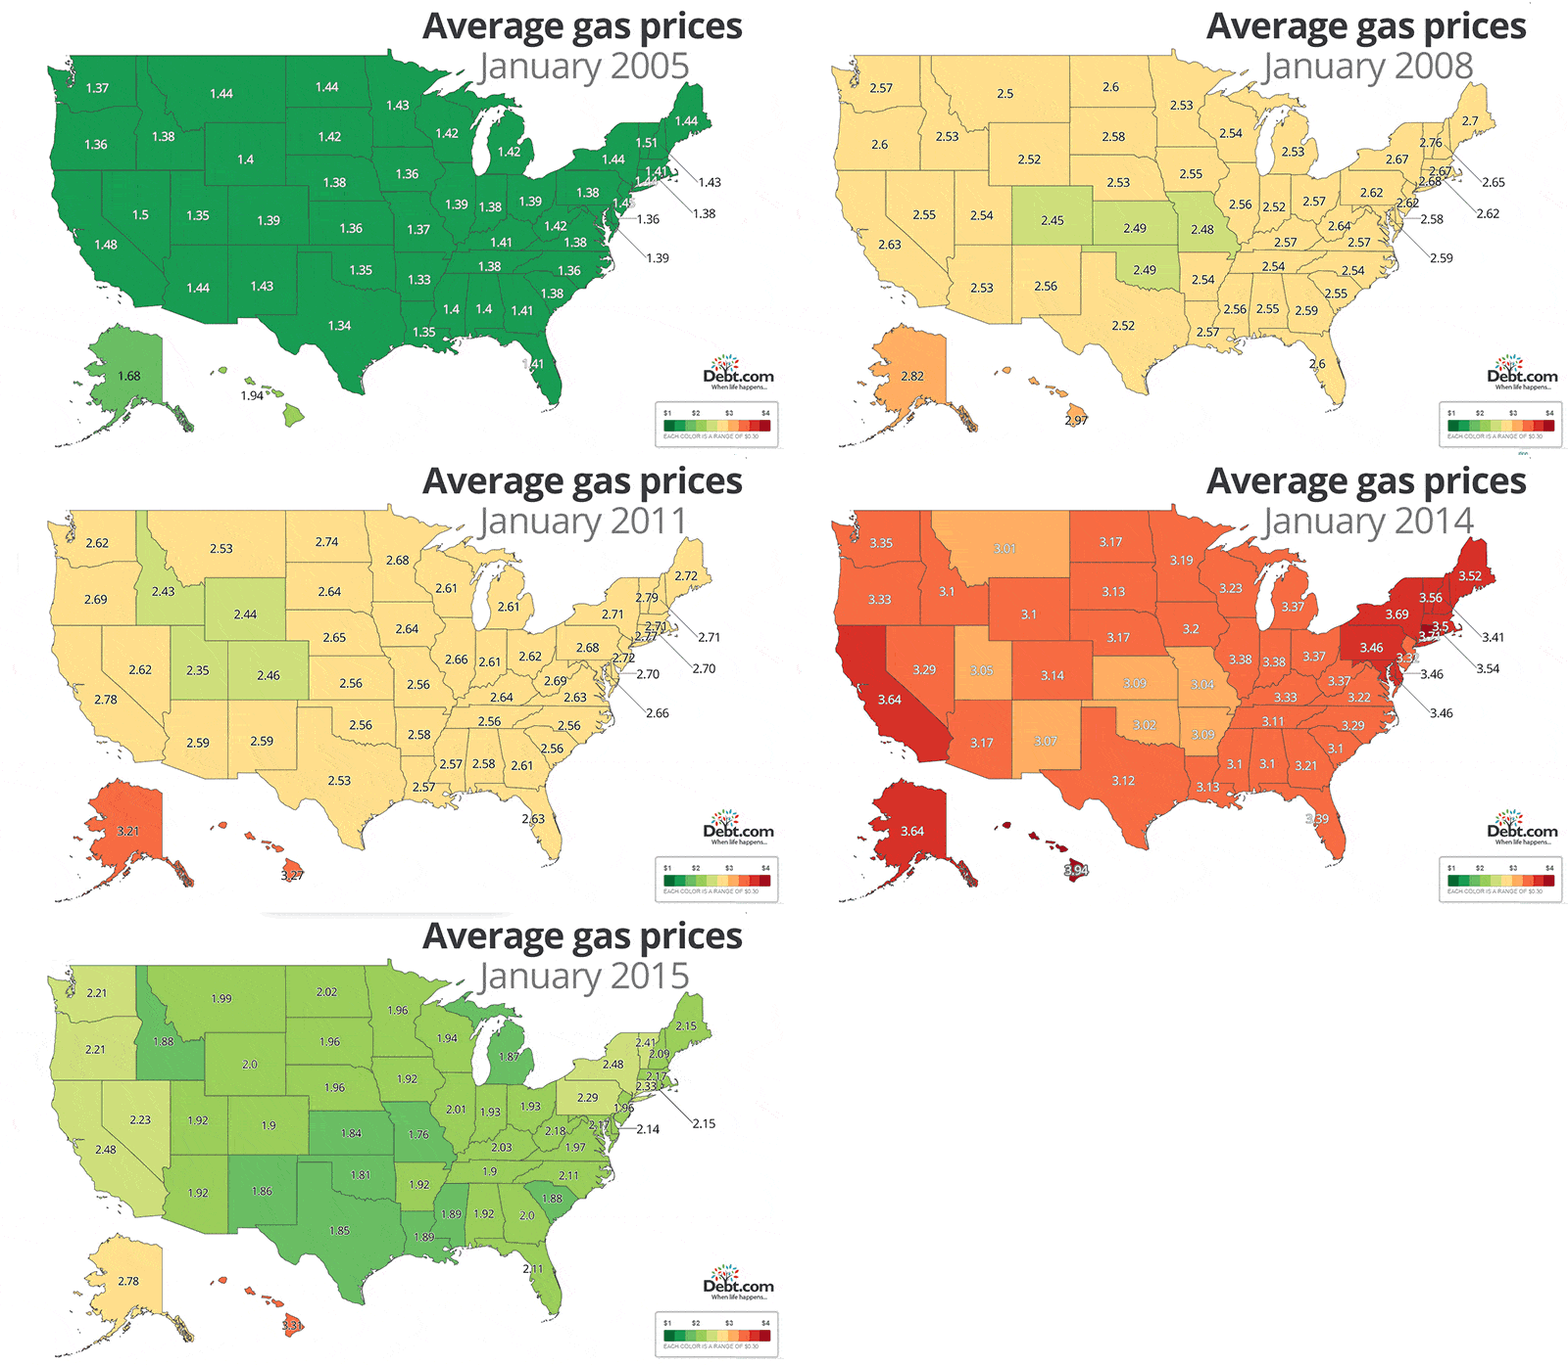
” What is the average price of gas in your state? Researchers at Debt.com have put together a map to show you.
Debt.com’s interactive map allows users to see their state’s average gas price-simply by hovering their cursor over the state. Clicking a state will show you its average price for the last 10 years:
While the national average for a gallon of gas is about $2.18, some states fare better or worse than others.
For example, drivers in Hawaii “consistently pay the most for gas.” They are currently paying an average of $3.31.
In addition to Hawaii, drivers in Alaska, California and the New England region pay among the highest average gas prices in the nation.”
More at The Daily Signal
—
Image may be NSFW.Clik here to view.
